Dashboard builder and drill-down
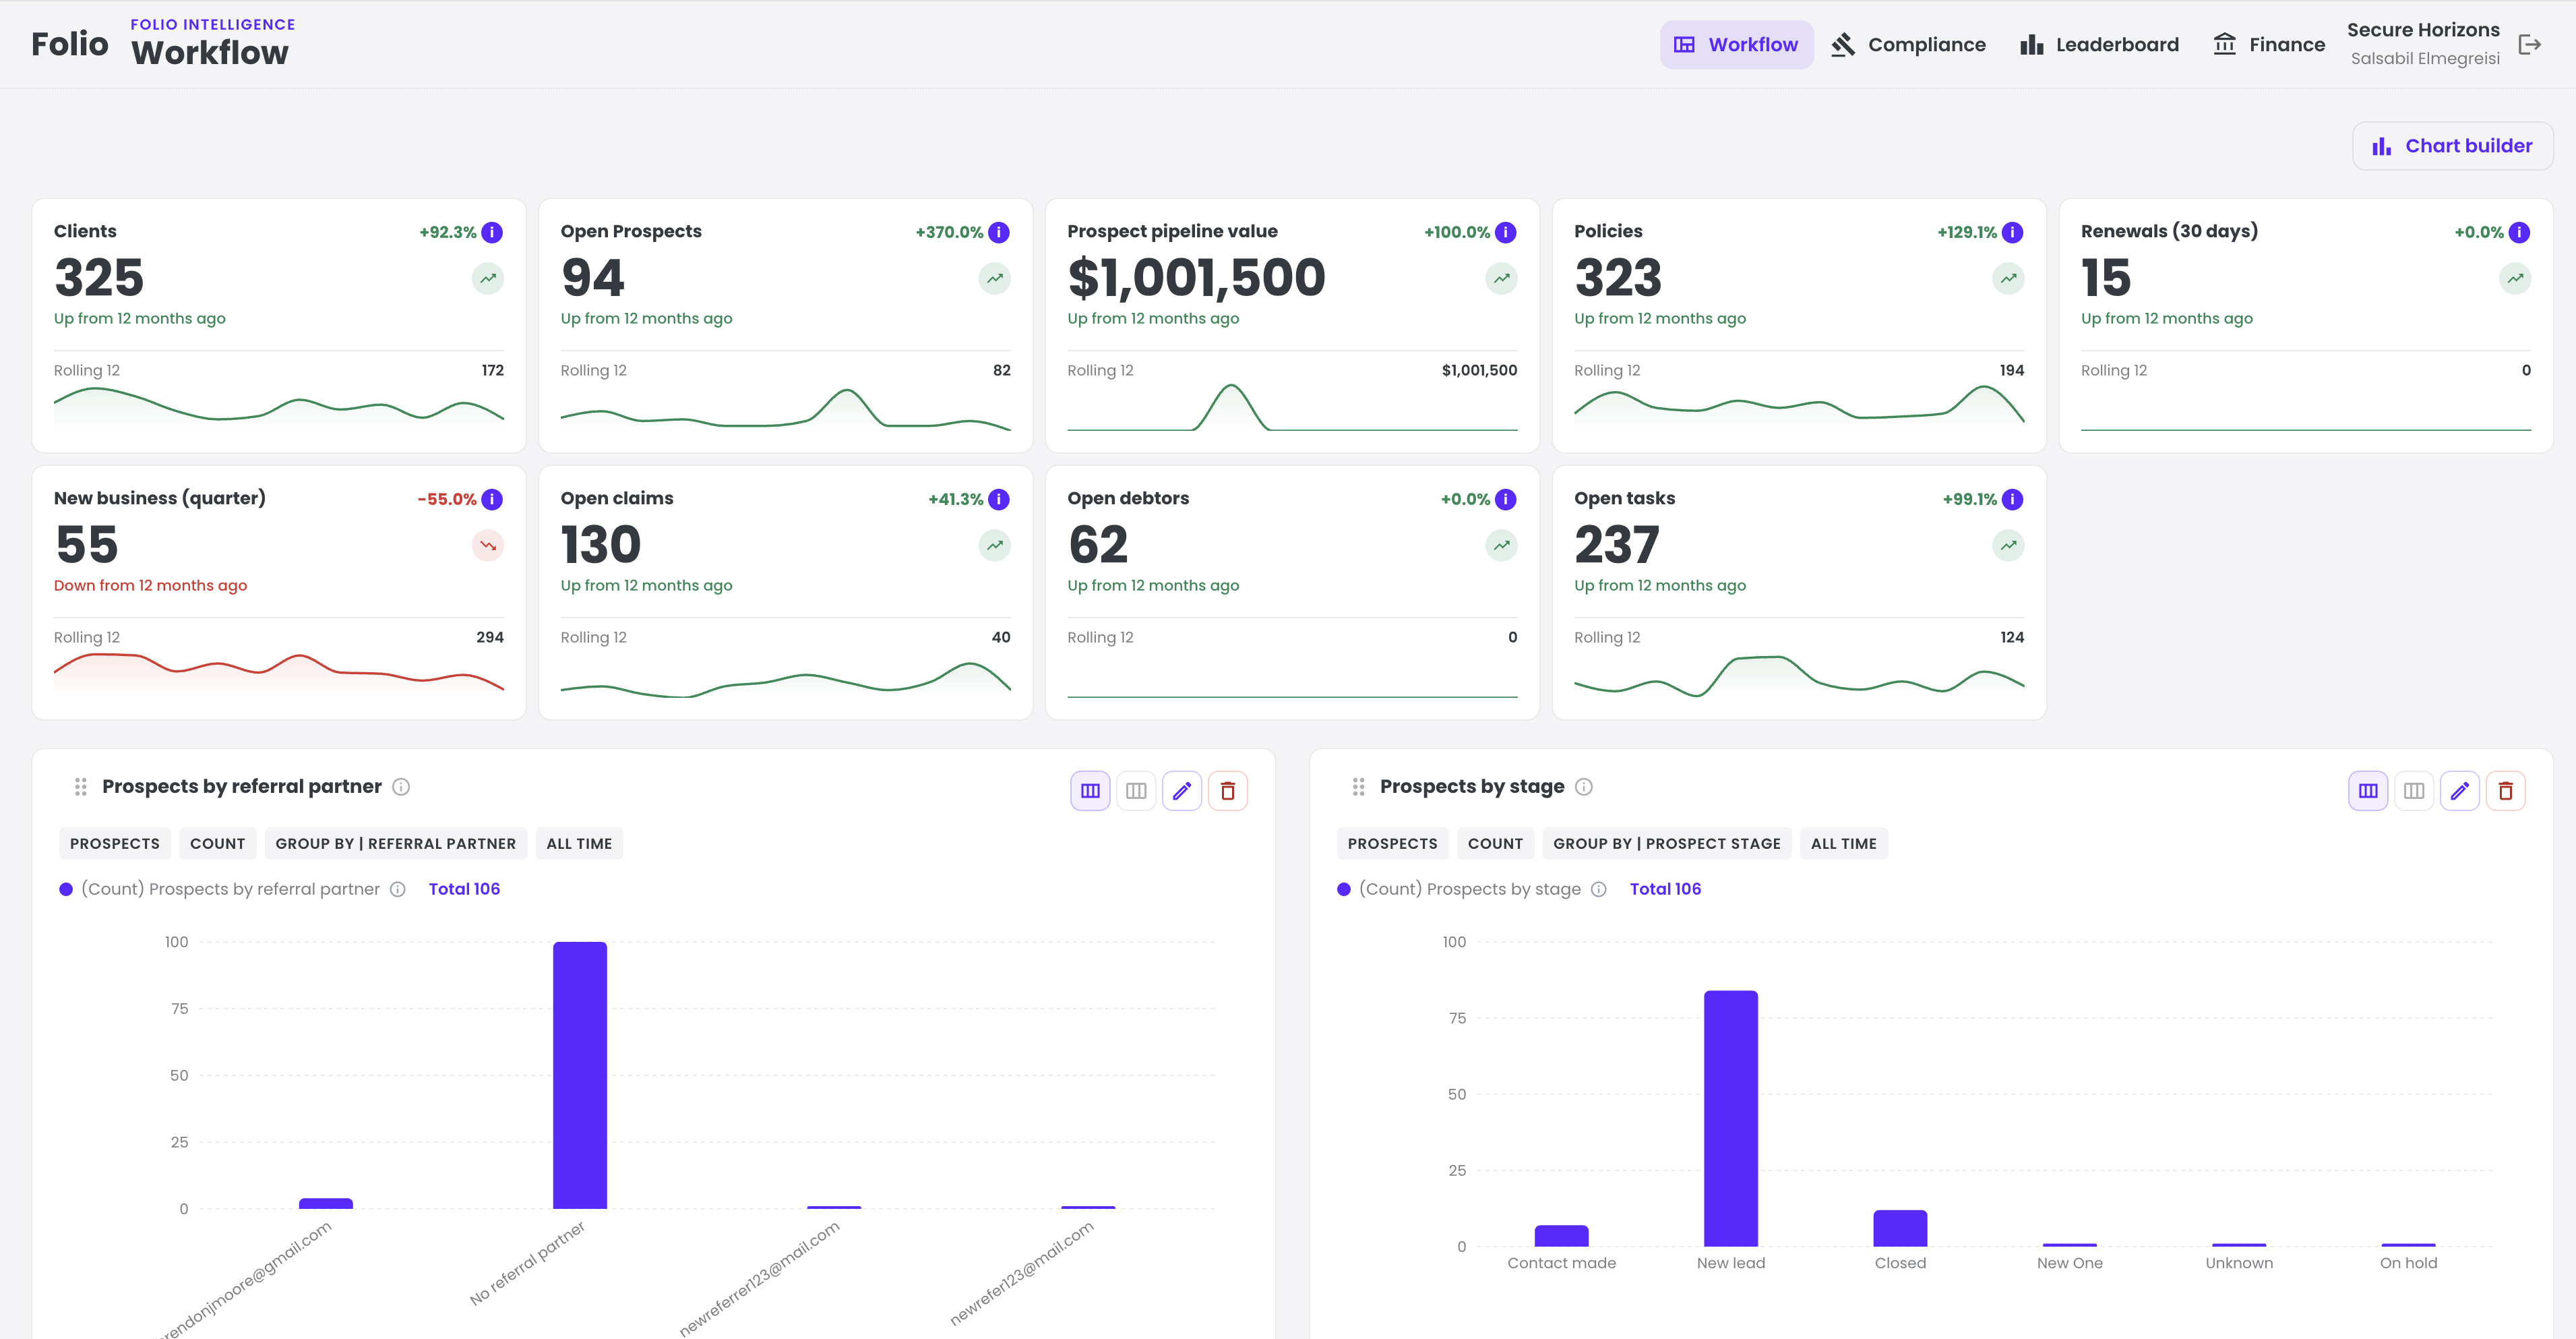
Build views from available Folio and connected PAS data, then move from the brokerage picture into the records behind it.

Connect Folio operating data with policy and financial data from your PAS. Understand workload, performance and opportunities as parts of the same business.
See it with your team ↗Demonstration views show the shape of the product. Metric definitions and data availability are confirmed for each environment.
Build views from available Folio and connected PAS data, then move from the brokerage picture into the records behind it.
Use agreed definitions and rolling periods so workload, retention and financial measures are interpreted consistently.
Explore clients, open prospects, prospect pipeline value, policies, renewals in the next 30 days, new business, open claims, debtors and tasks. Use chart building and pipeline views to examine the work.
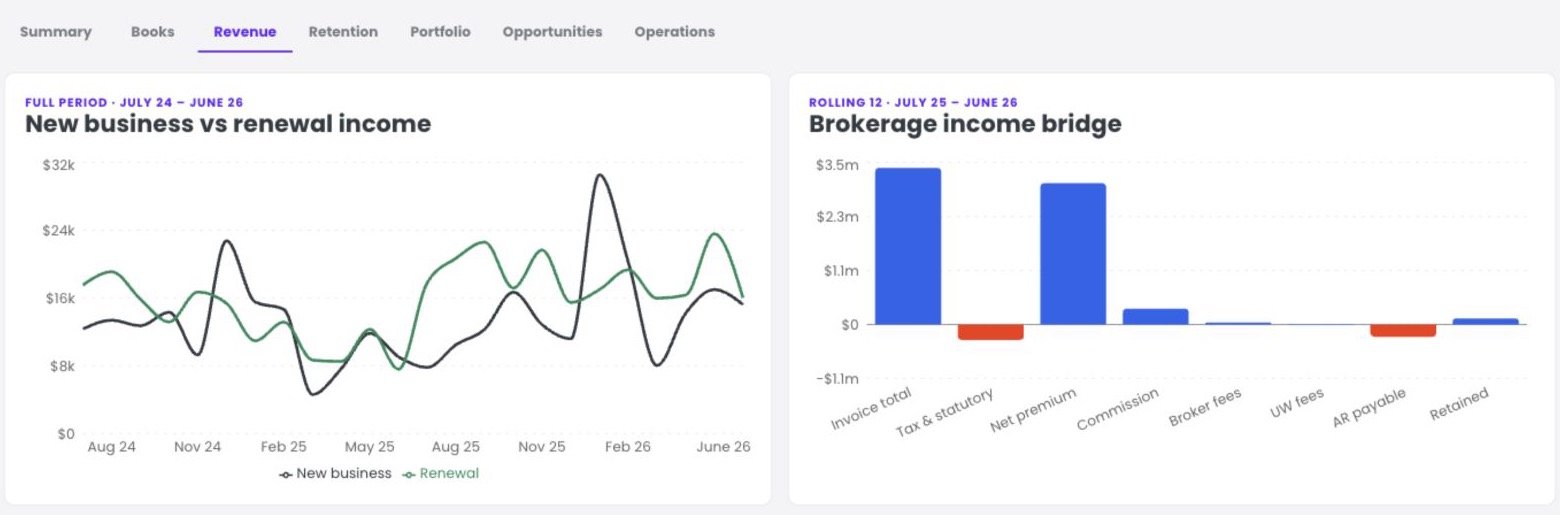
Review written premium, brokerage income, new business and renewal income, lost cancellation impact, active clients and policies, and average income per policy. Available views include Summary, Books, Revenue, Retention, Portfolio, Opportunities and Operations.
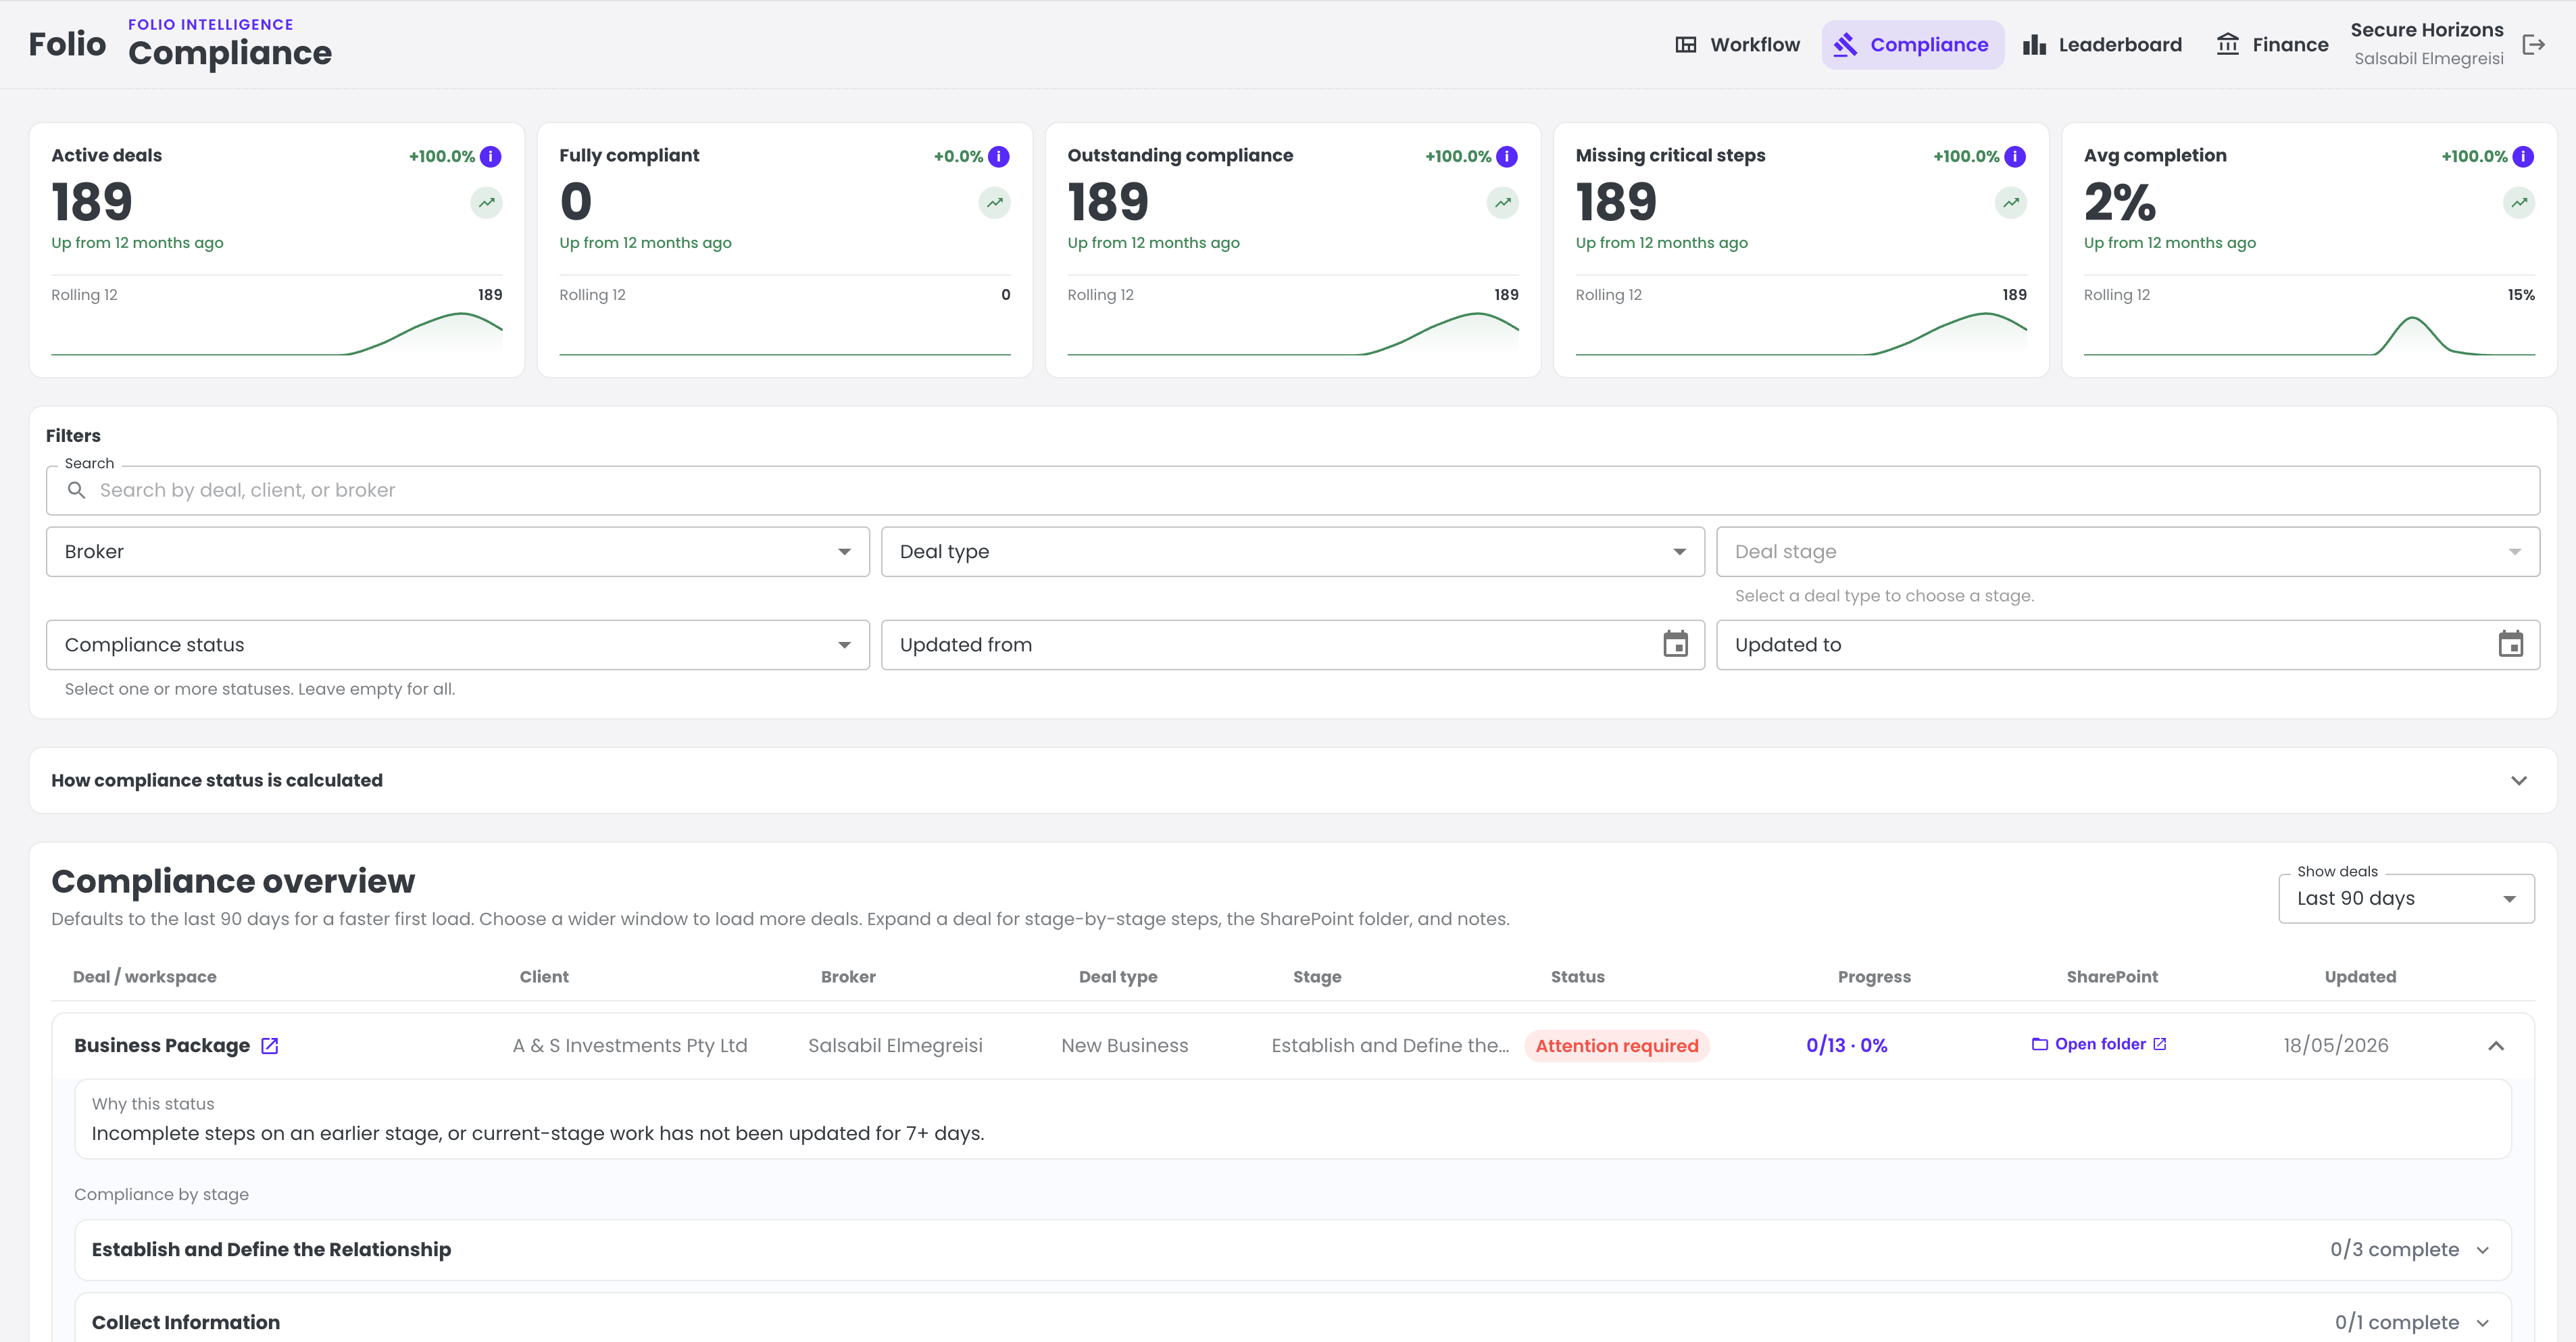
Deal-level views show work performed in Folio and help identify process steps that need review. These views support management oversight; they do not replace professional judgement or determine regulatory compliance.
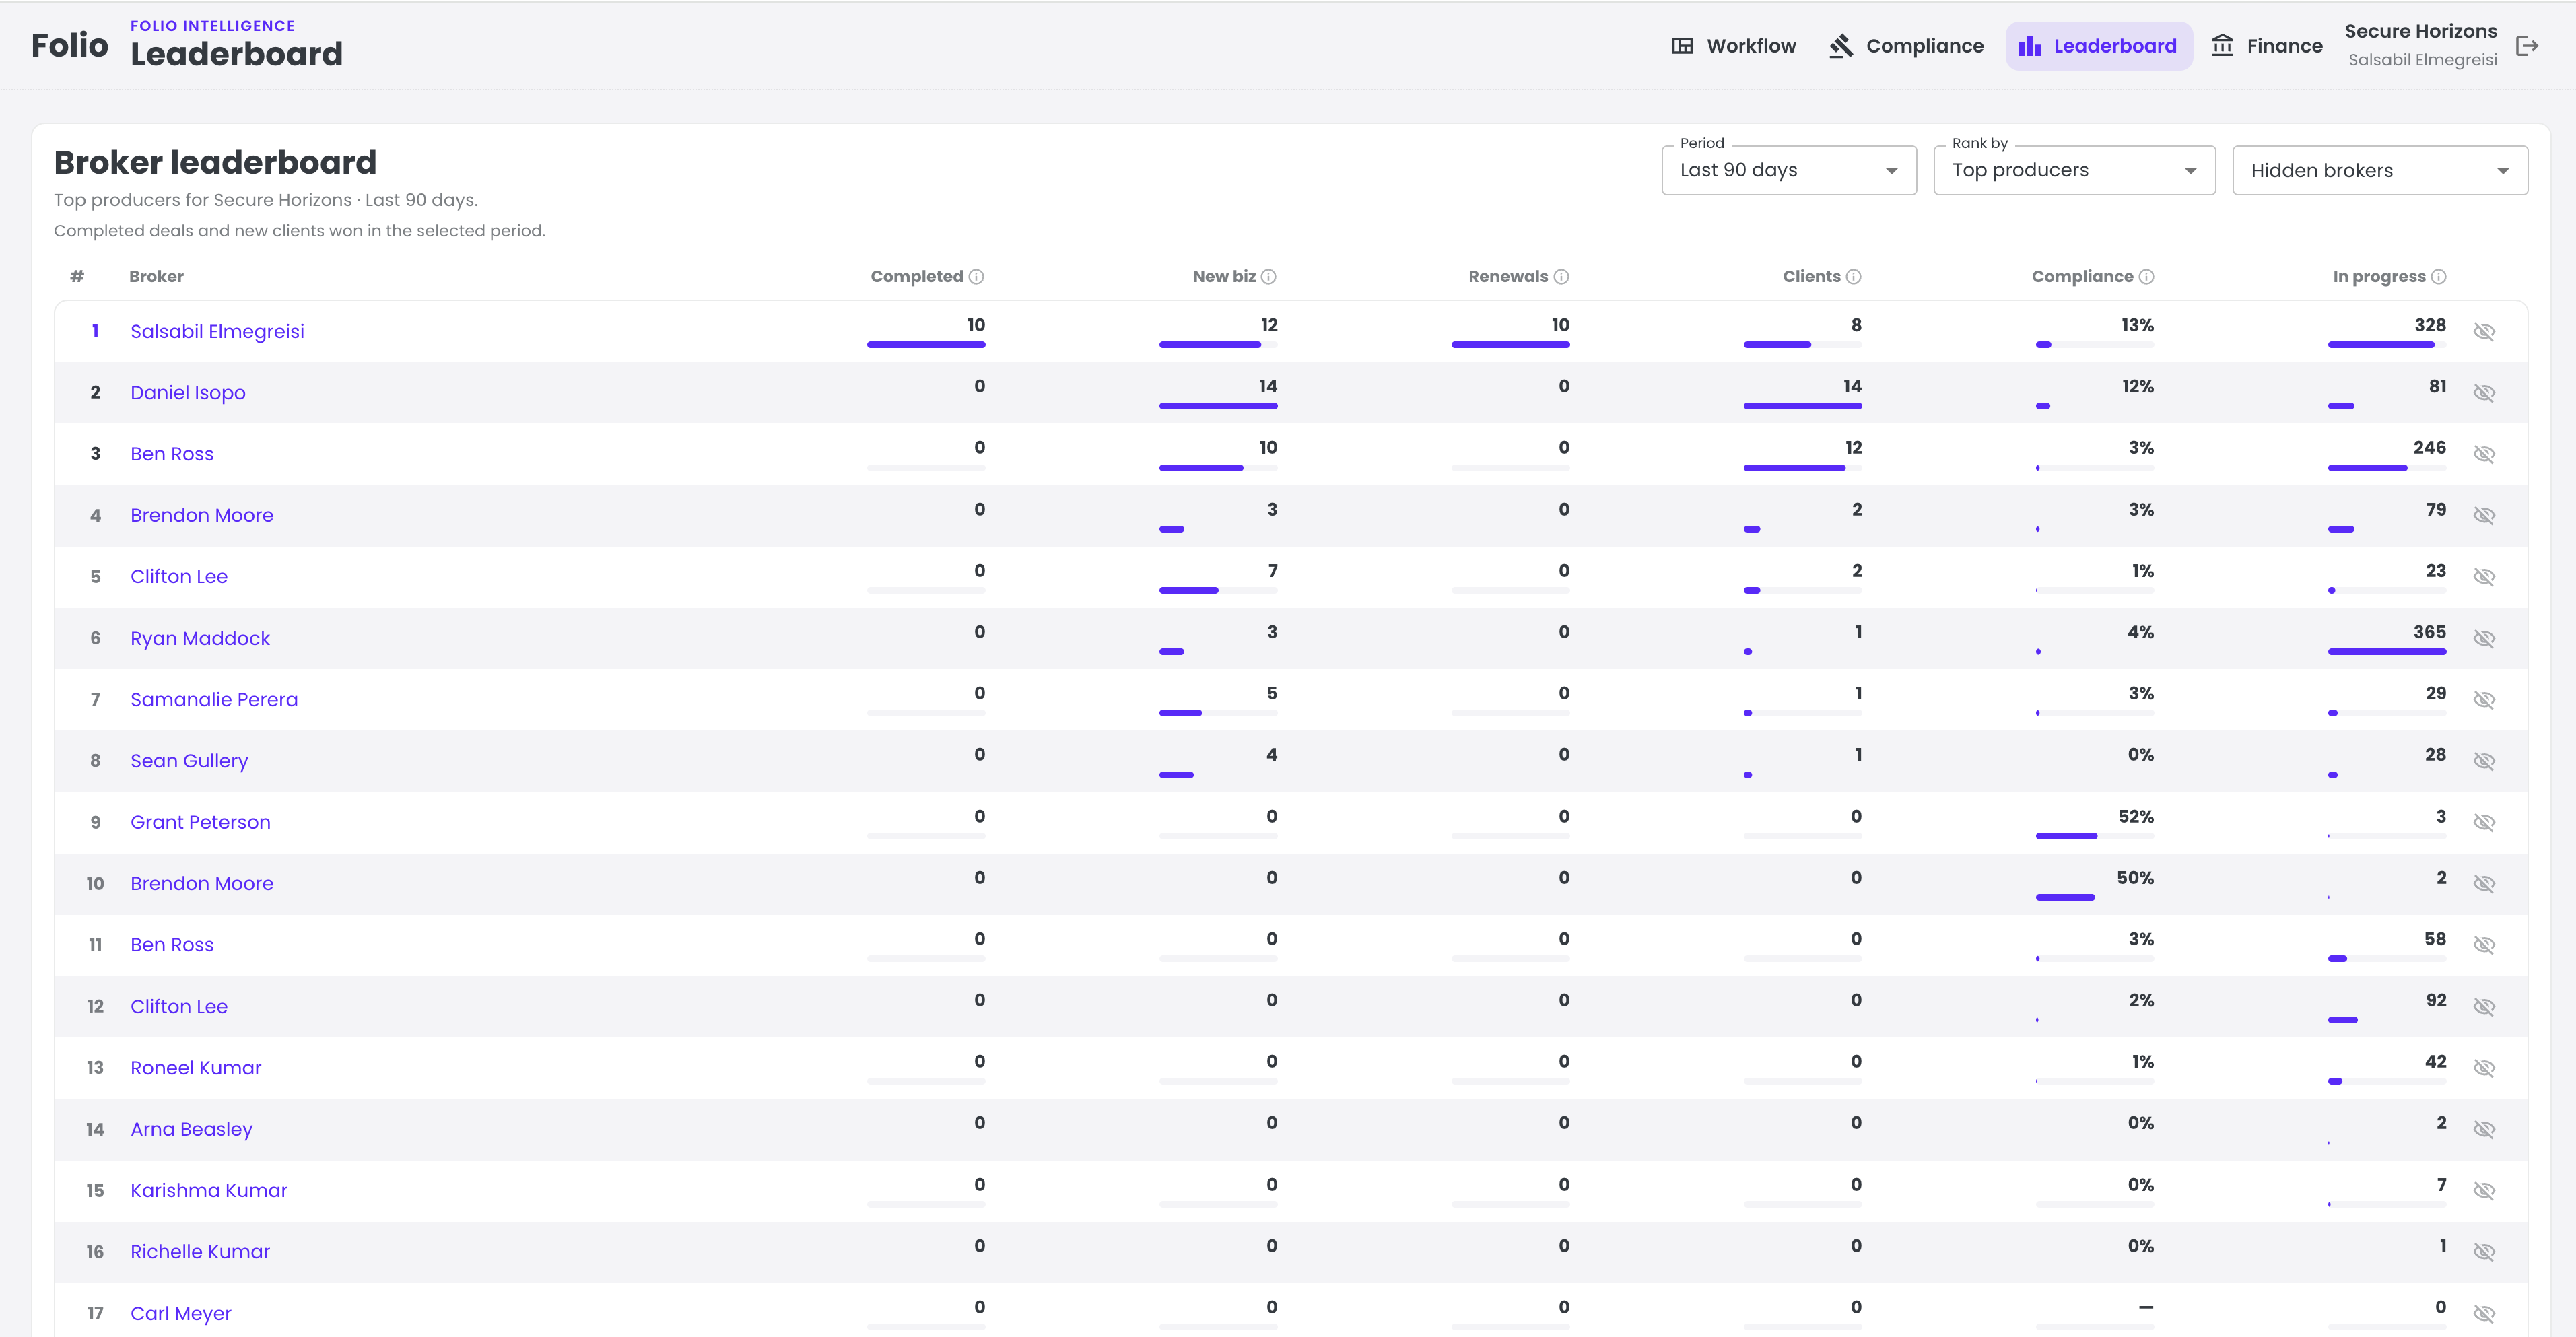
Explore team activity and performance, and build views using data available in Folio and the connected PAS. Confirm metric definitions, comparison periods and data availability for your environment during discovery.